Is this open rate good? Email statistics the public sector needs to know
You can’t gauge your success if you can’t measure it to begin with. Fortunately, the modern digital world of comms is one awash with numbers. Let’s focus on email marketing-communications, since email remains kingpin of the marketing mix (and it’s what we know best). You’ve got open rates, engagement rates, click rates, subscription rates – there’s a number for everything!
But even when you have the email metrics at your disposal, what are you to do with them? Is a 20 per cent open rate “good” or “bad”? If on average your subscribers are opting to receive two different email updates from your organisation (two subscriptions-per-subscriber), is this an indication you have an engaged well-served audience?
And why do these metrics matter? What can they say about the potential success of your campaigns, programmes and services?
Performance statistics for the public sector only – because it’s special
Granicus set out to provide clarity to the public sector by releasing the 2018/19 Email Marketing Benchmarks and Best Practices guide — the only major communications report that focuses exclusively on numbers government and public services in the UK can use to compare “apples to apples”.
We think this is important because 1) the nature and purpose of public sector comms can be extremely unique, and 2) it consistently exceeds the private and non-profit sectors’ email marketing performance in terms of audience engagement.
Data from 200 public services
Our latest numbers pull together statistics from nearly 200 organisations using govDelivery – a secure digital engagement platform for the public sector.
The report covers a number of different performance metrics, benchmarks, and examples of great emails achieving results. We’ve shared more details in the guide. Here’s a quick overview of the metrics that matter most:
Engagement rate
What is it? The number of unique email recipients who opened an email or clicked on a link in an email over a period of 90 days, divided by the total number of people who received an email during that time.
Latest numbers: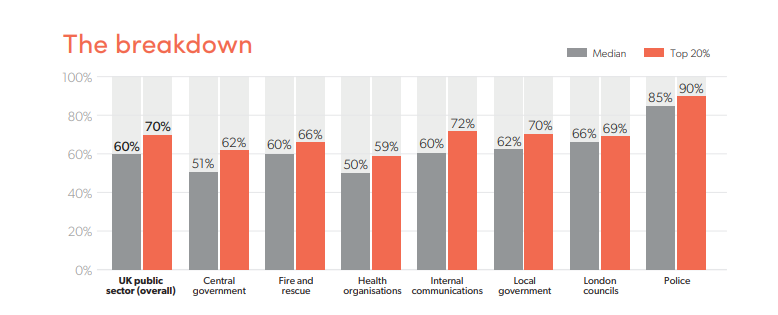
Open rate
What is it? The number of recipients who opened an email divided by the number who received it.
Latest numbers: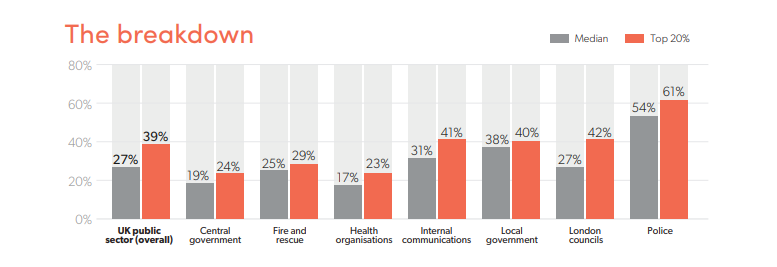
Click rate
What is it? The number of recipients who clicked a link in an email divided by the total number who received it.
Latest numbers:
Overlay impact rate
What is it? The number of people subscribing to an organisation’s updates via a web overlay (data capture form), divided by the total number of subscribers who signed up online through a subscription link (12-month average).
Latest numbers: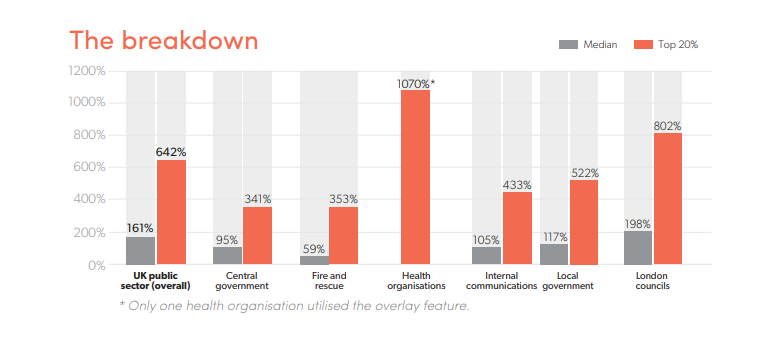
Want a deeper dive into each of these email statistics (including annual trends), tips for improving your metrics and case studies? Download the entire 2018 Granicus Benchmark Report now.
Network impact rate
What is it? The number of people subscribing via another organisation in Granicus’ network (which is growing fast, with nearly 200 UK-based organisations using govDelivery already), divided by the total number of subscribers who signed up online through a subscription link (12-month average).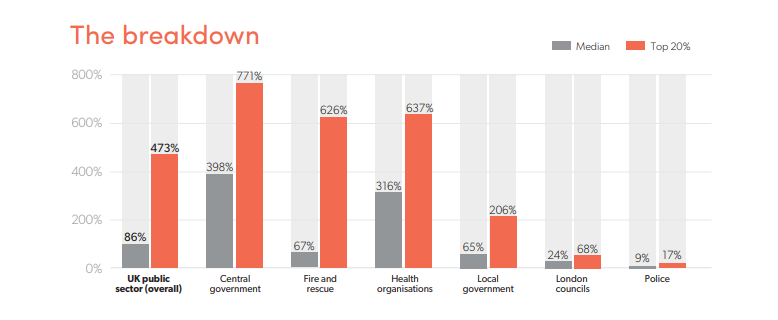
Subscriptions-per-subscriber
What is it? The number of “topics” an individual has signed up to receive email updates for, calculated by dividing total subscriptions by total subscribers.
Latest numbers: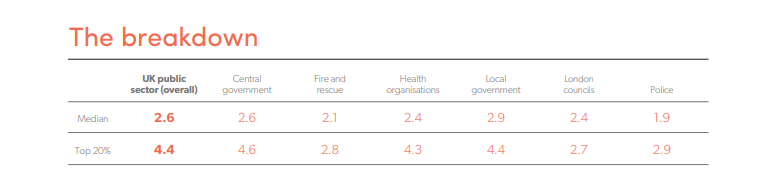
Want to dive deeper into each of these email statistics?
Download the Email Marketing Benchmarks and Best Practices for the UK Public Sector for:
- Average performance metrics for central government, local authorities, London borough councils, the police, fire and rescue services and health organisations
- Easy ways to improve your numbers
- Case study examples of email marketing good practice